Hello from DC! I’m in town for the Esri Federal Users Conference this week. One of the projects I work on is for the Navy’s energy program - we help track energy consumption for every naval facility in the world. every once in awhile i get the opportunity to make some data-viz-type-posters to help simply show how crucial this information is.
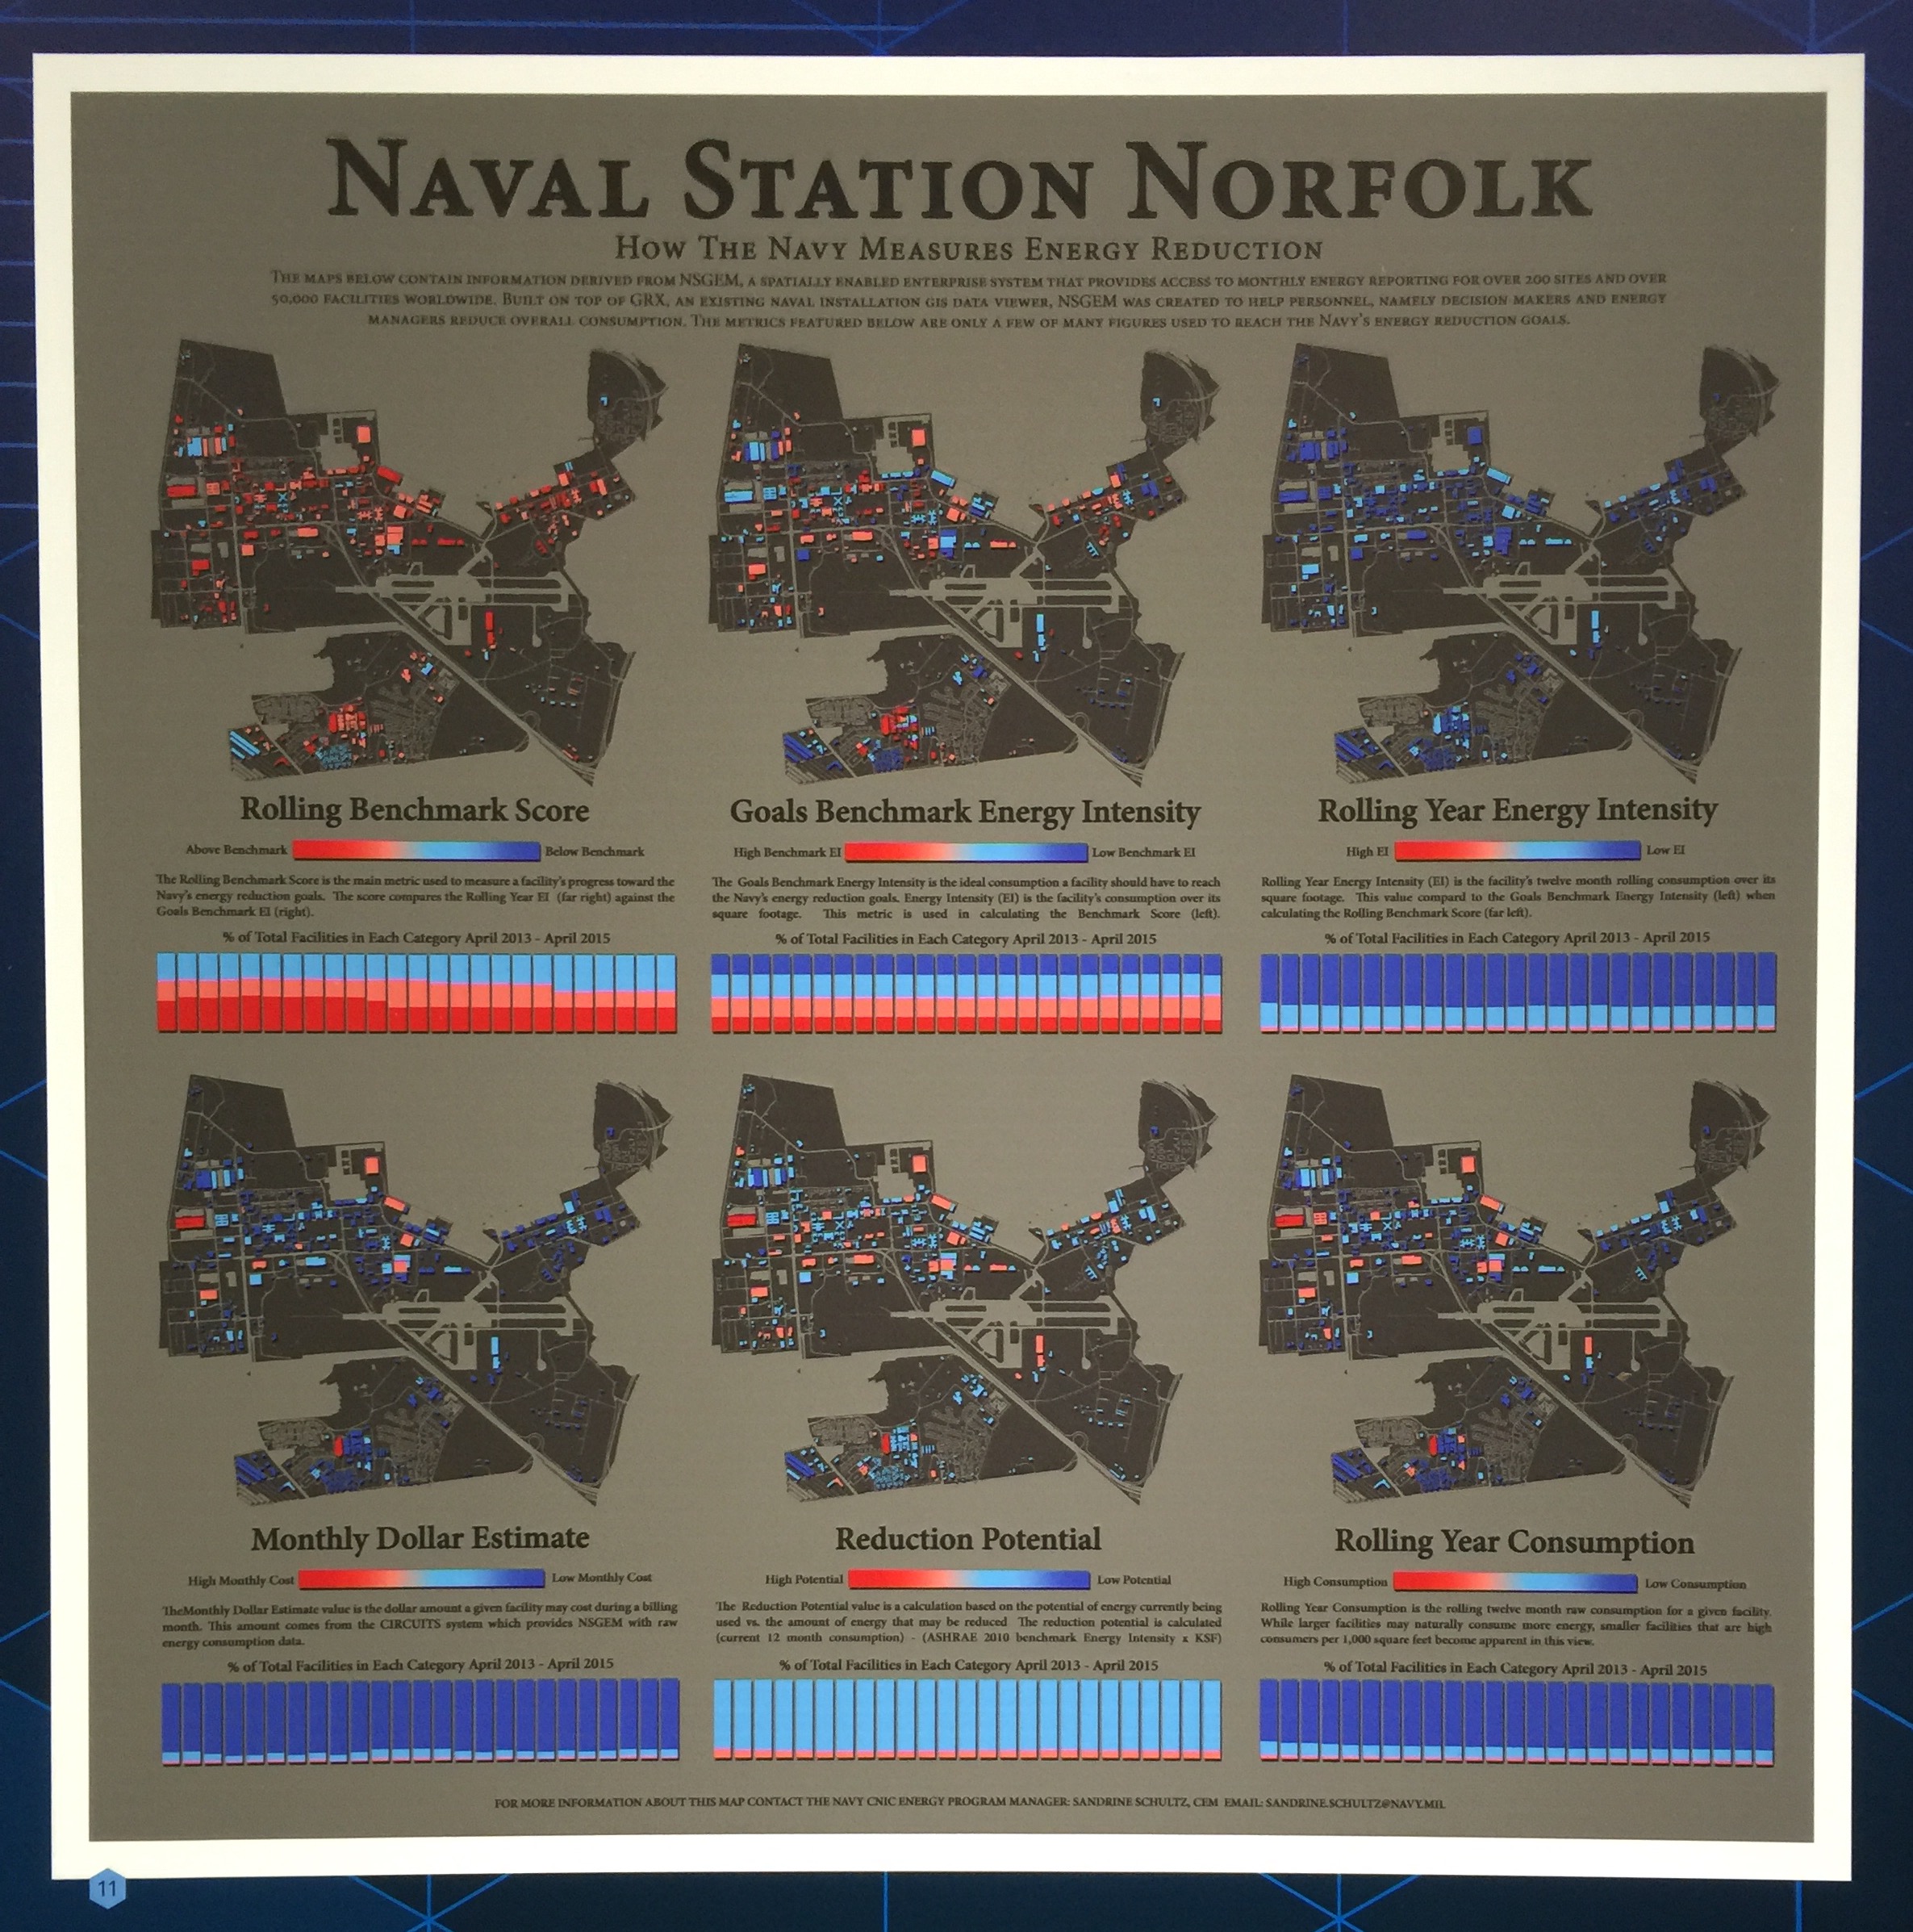
This is take on small multiples for several common metrics at Naval Station Norfolk.
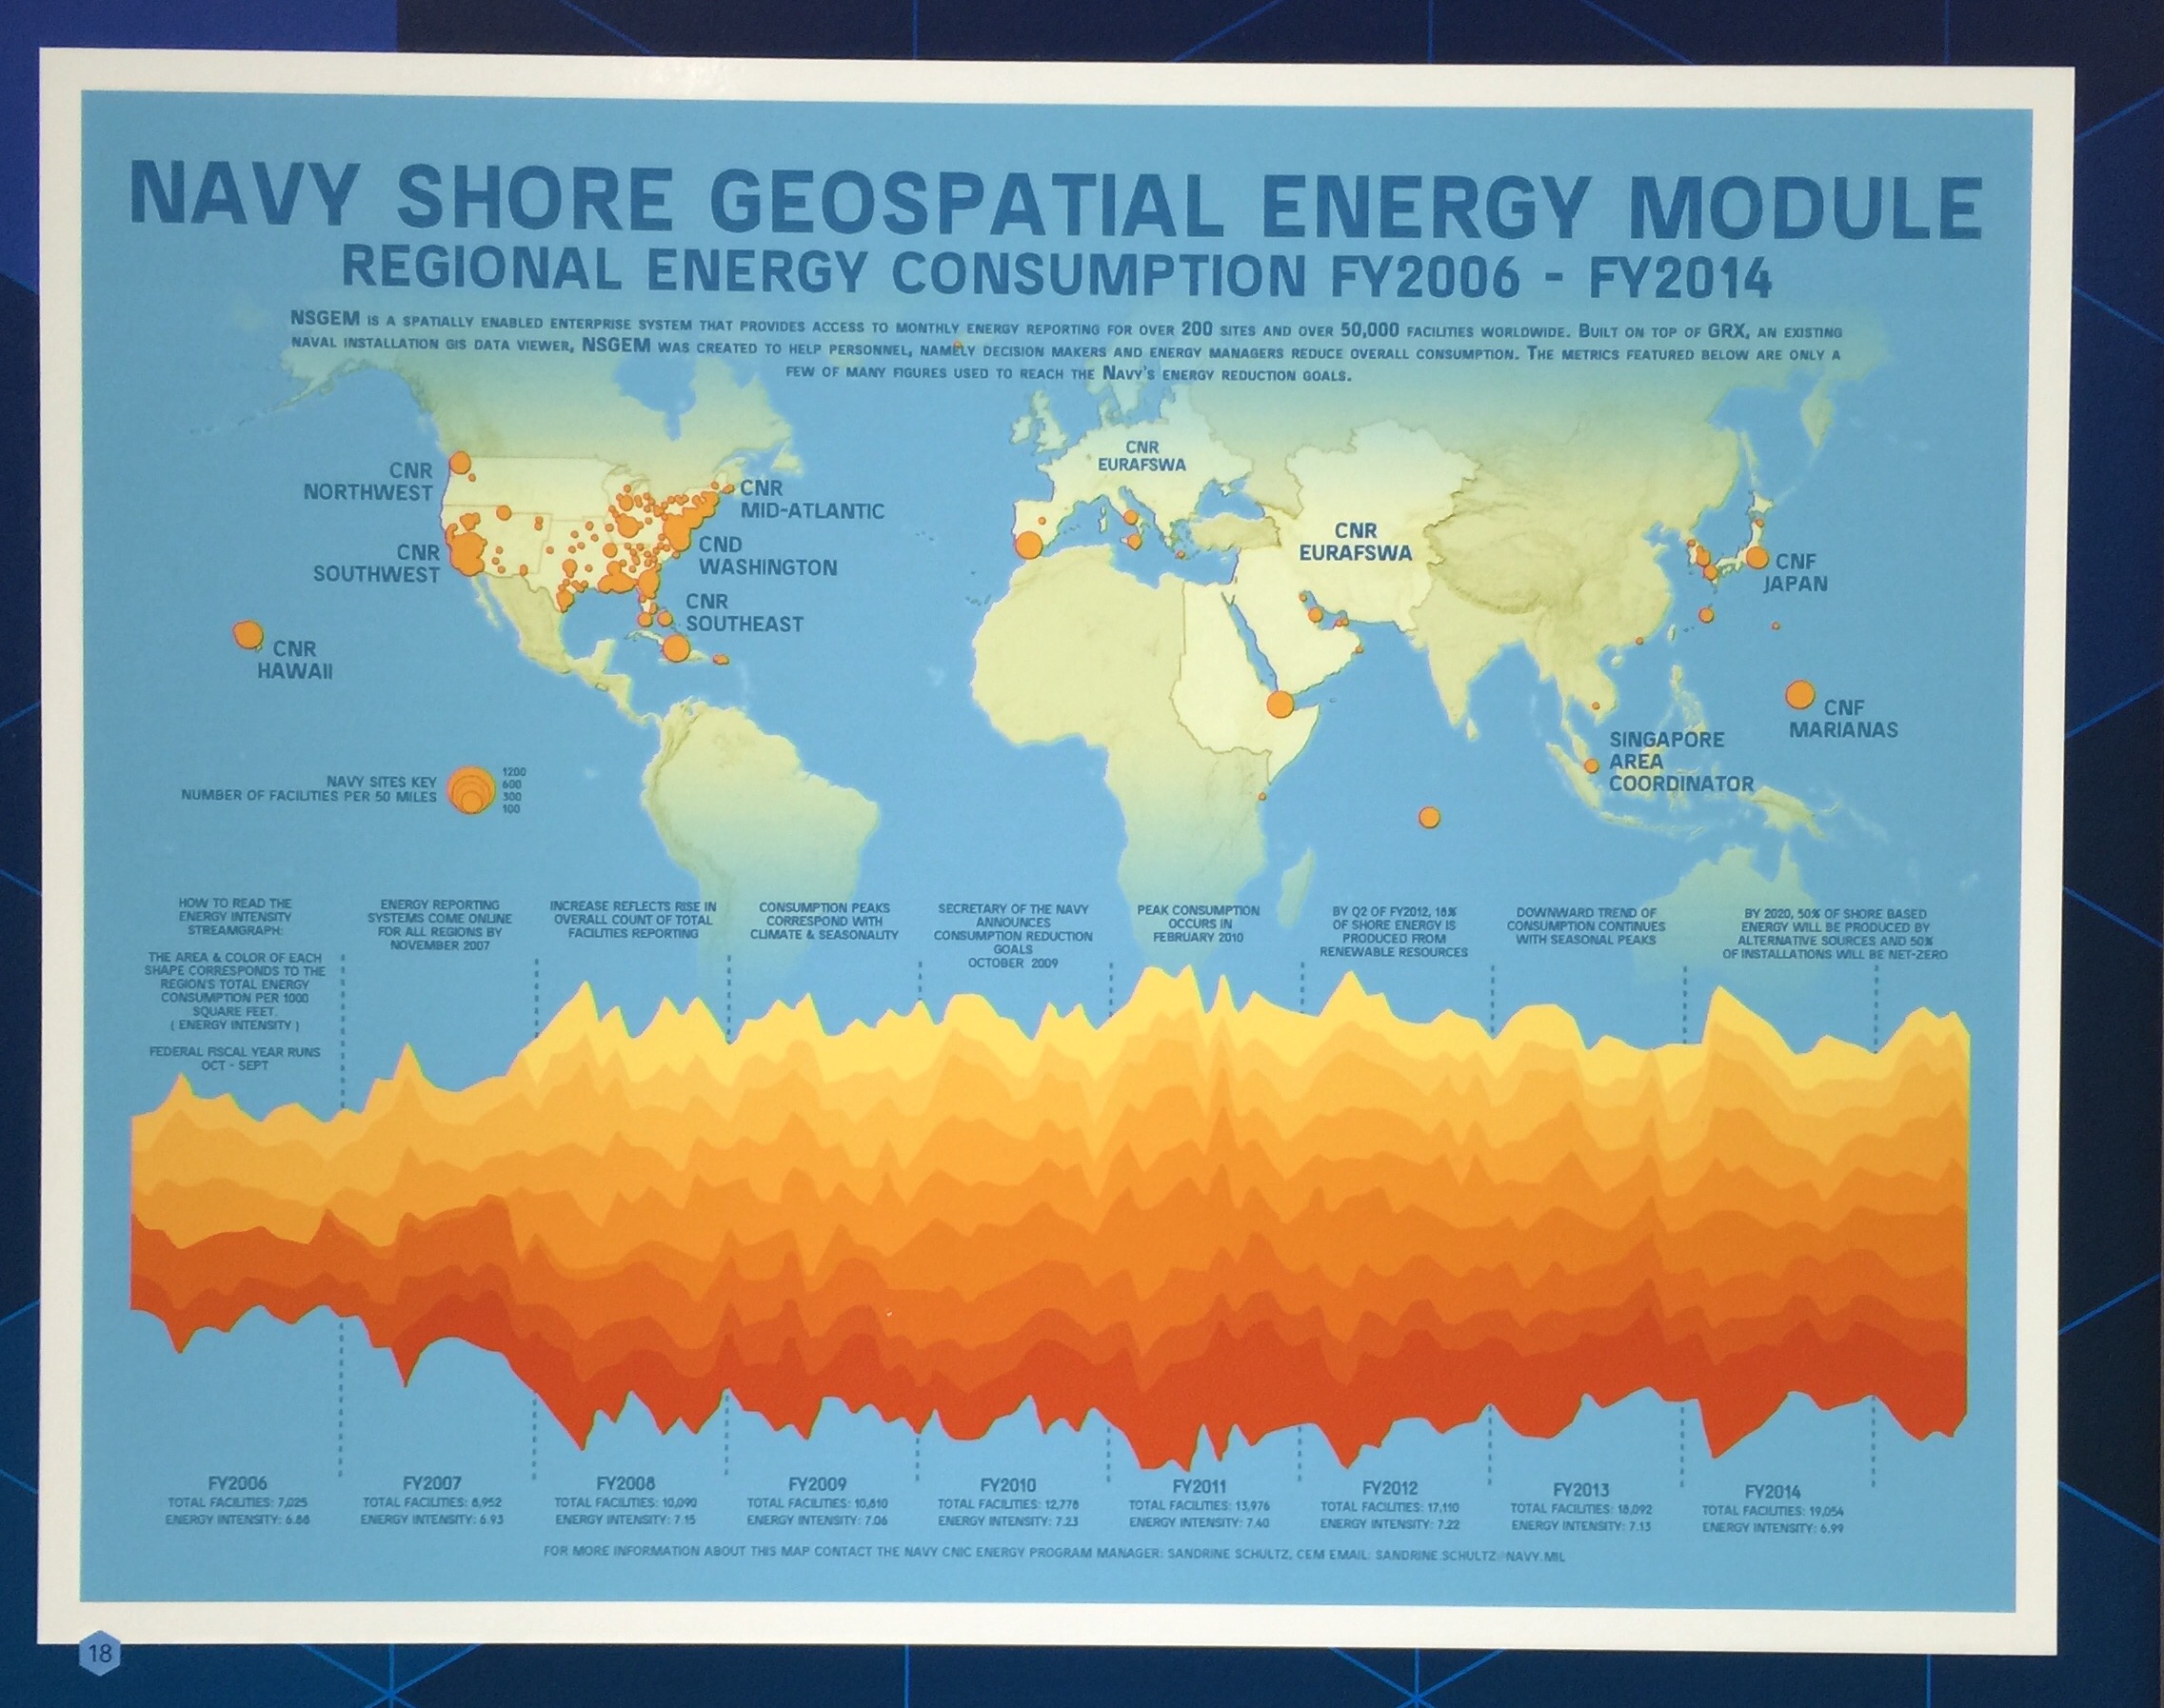
In this viz, total consumption is shown by region, a geographic area that groups navy installations. The stream-graph shows the overall rise in consumption has data starts being tracked, and the eventual tapering off as reduction measures are introduced.
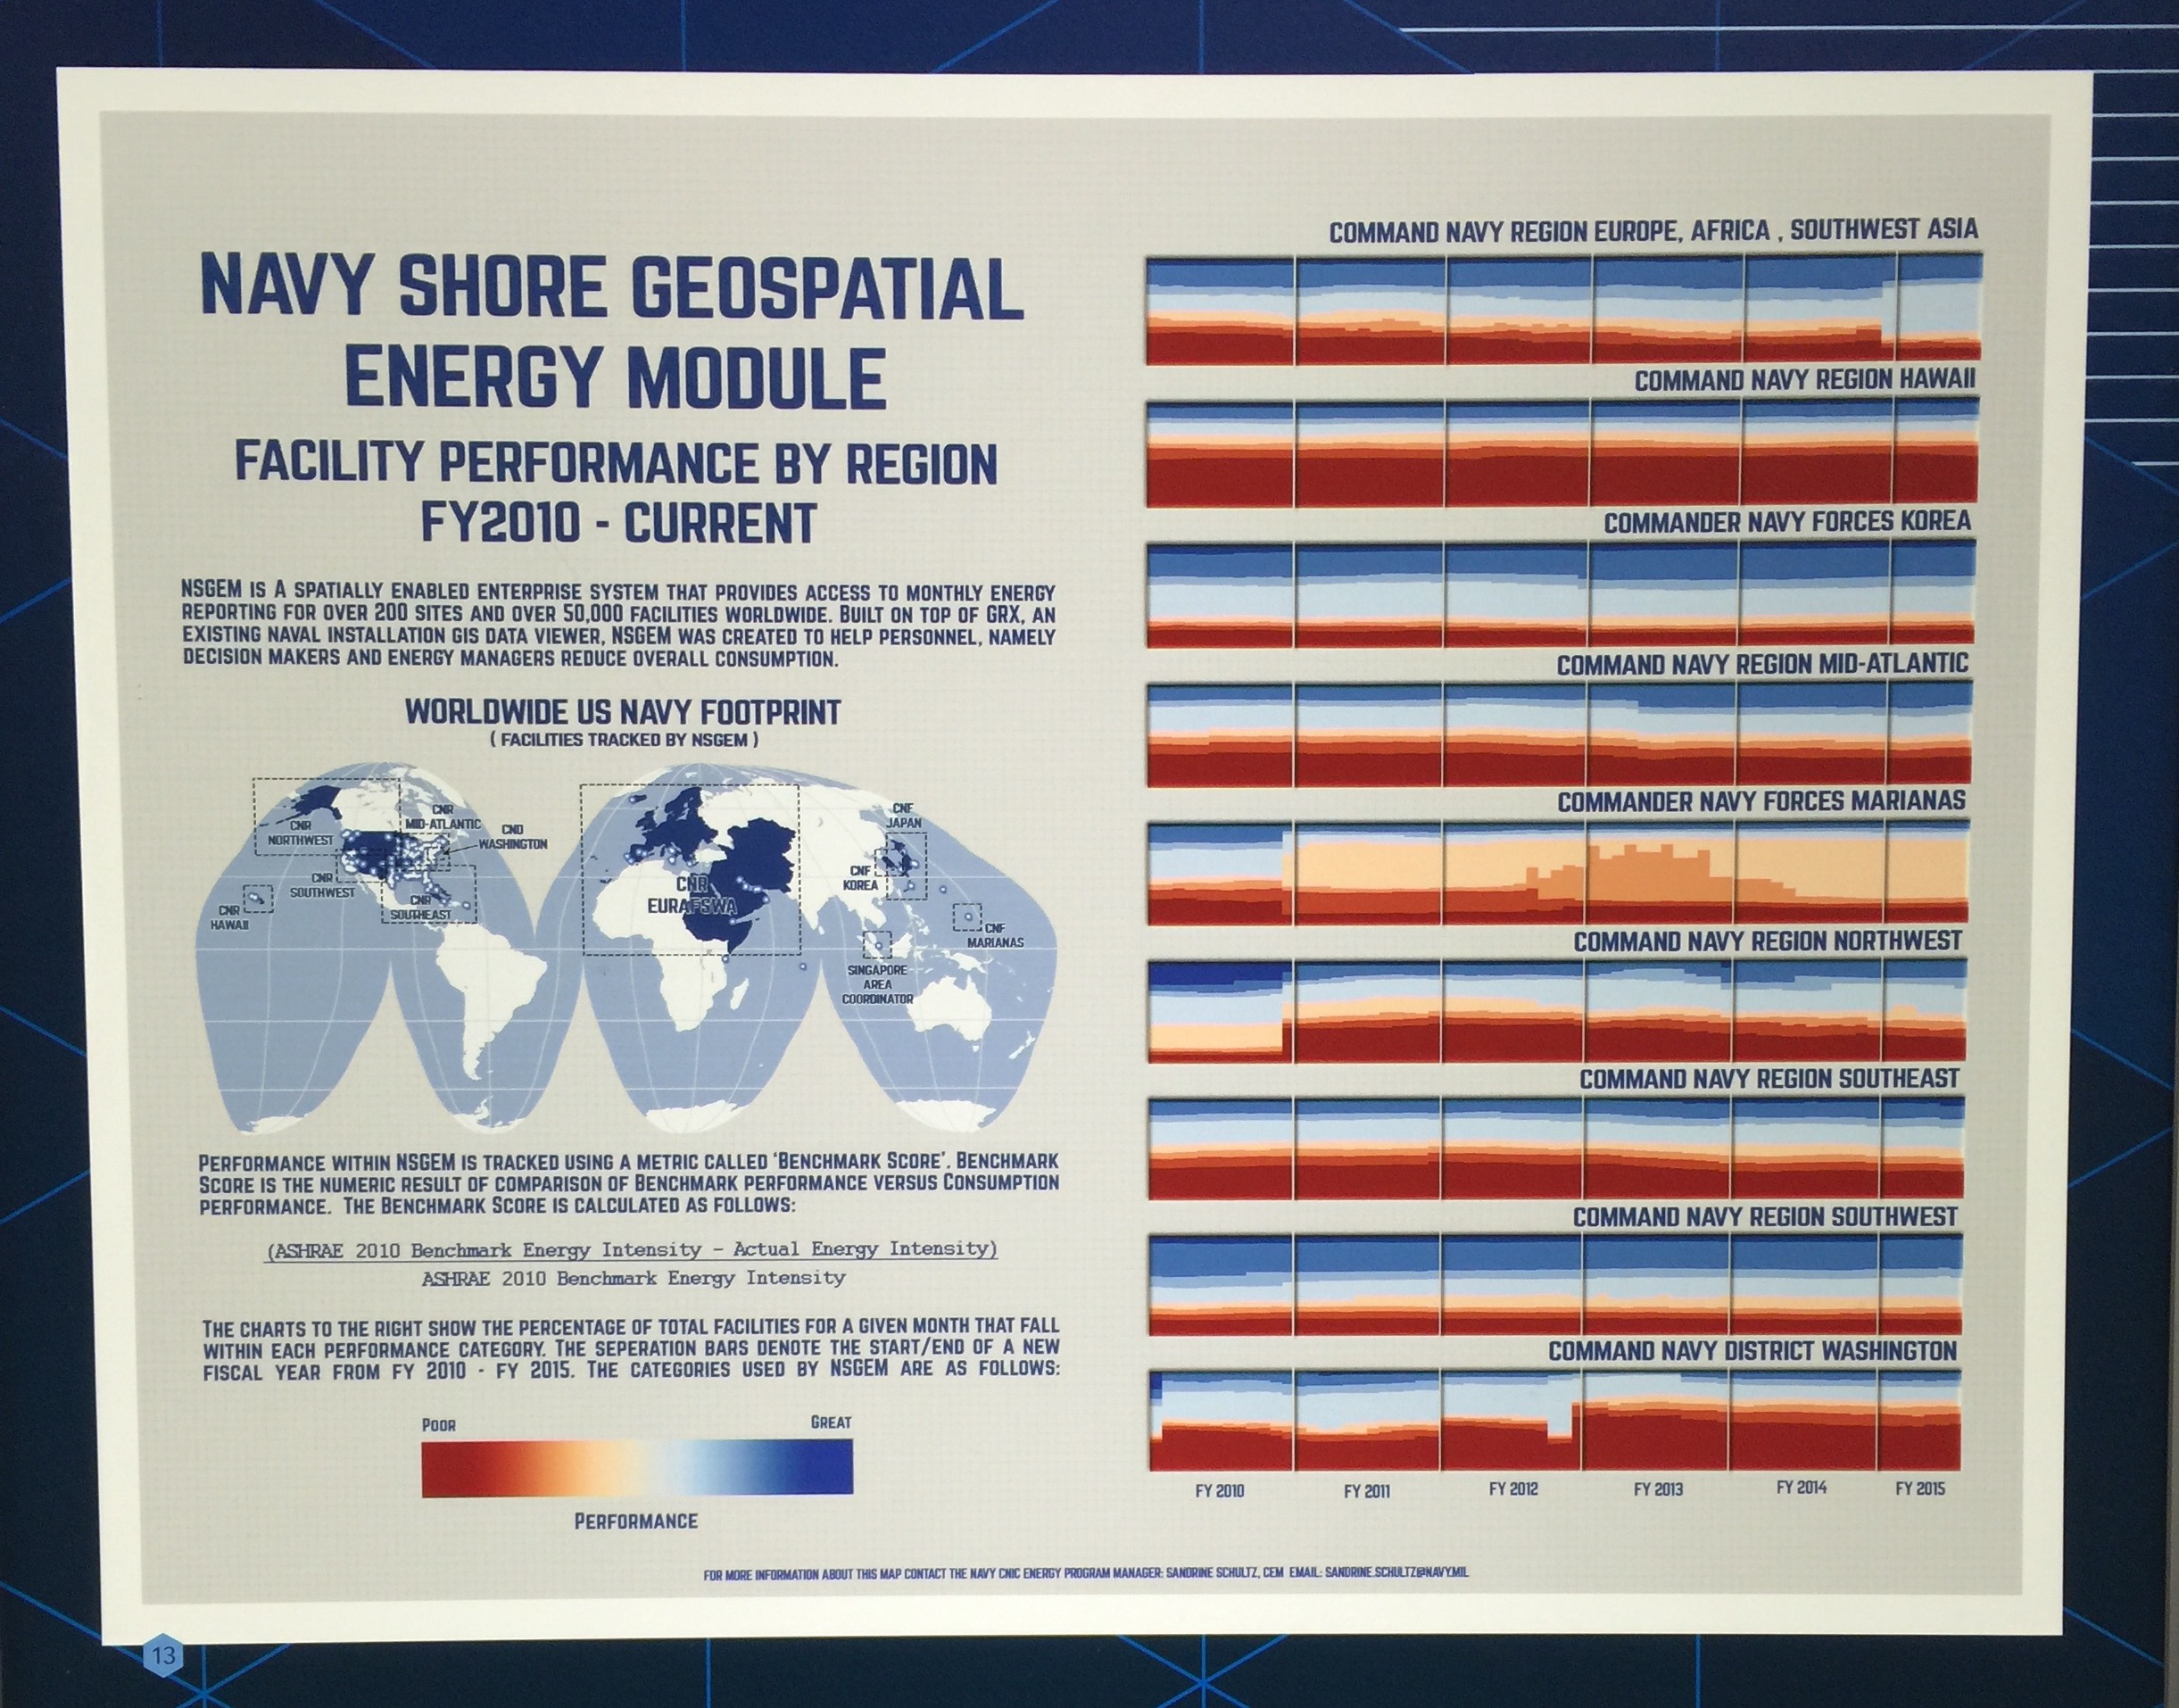
On this one, each of these region graphs show the performance of all facilities across time.