If you’ve been following along with John Nelson’s ArcGIS Pro blog series over at Esri, you’re well aware of the creative and beautiful map how-to’s he’s been putting out. When I saw the How-To: Electo-Cubo-Gram, I got really inspired. In the article, he details how he created a kind of forced cube perspective view from 2d hexagons. It’s a really crafty and really great effect.
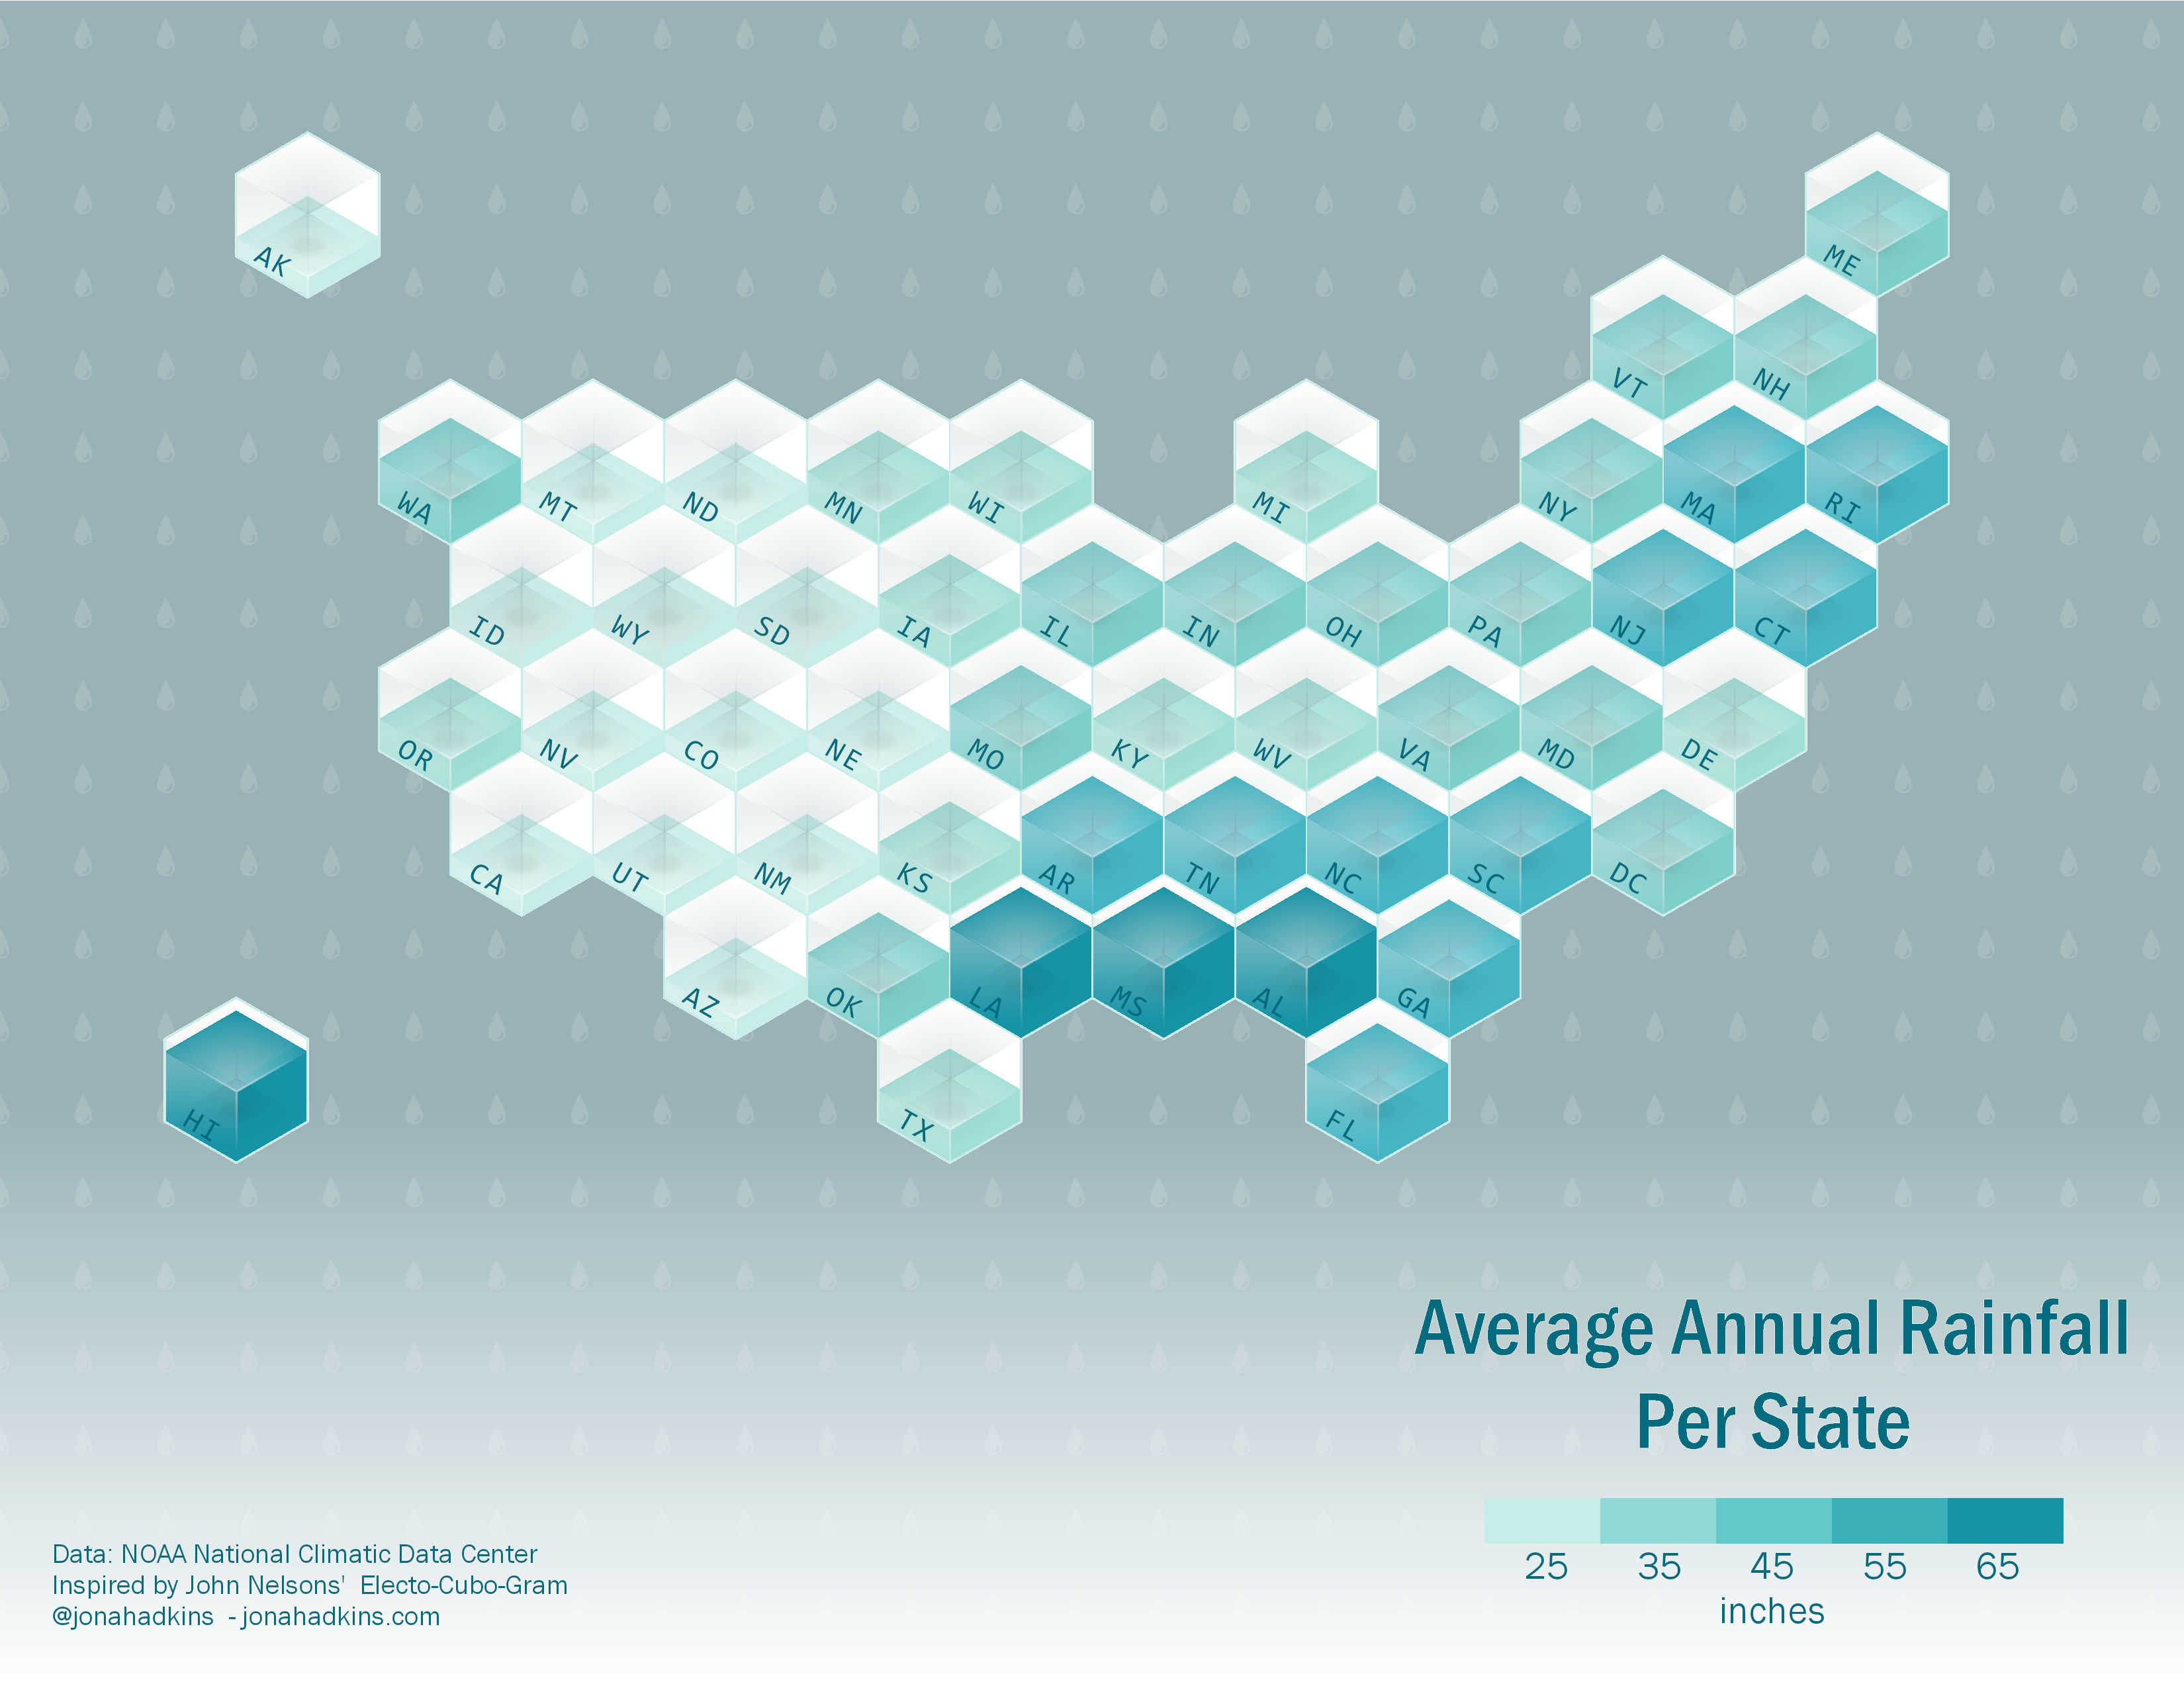
I was curious and inspired enough to see if I could fill those cubes with water. Using average annual rainfall data from NOAA, I used John’s great steps and began experimenting. His steps got me most of the way there - the majority of what I did revolved around the method I used for my rain-filled effect.
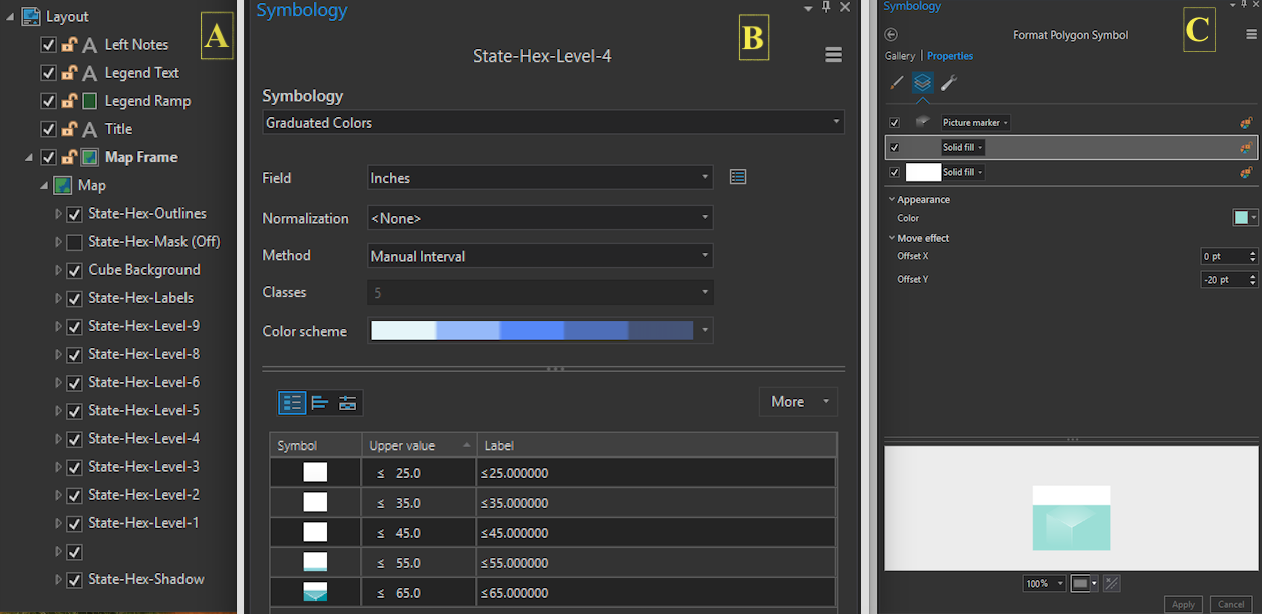
I’ve shared the ArcGIS Pro project package for you to explore or edit on your own, but I’ll briefly explain here.
There’s many copies of the same layer (state hexagons), each doing their own part to complete the picture. (a) The fill colors (rain fall) are done using graduated color symbology separating the rain fall amount into five categories from 0-65 inches. (b) To visually show the average inches of rain per year as water filling a cube, I used the polygon move effect to offset the entire shape by 5 points on it’s X axis. So a state in the 65 inch category was moved down 5 points, and a state in the 55 category was moved down 10 points, and so on down to the 0-25 inch category being shifted down 25 points.(c)
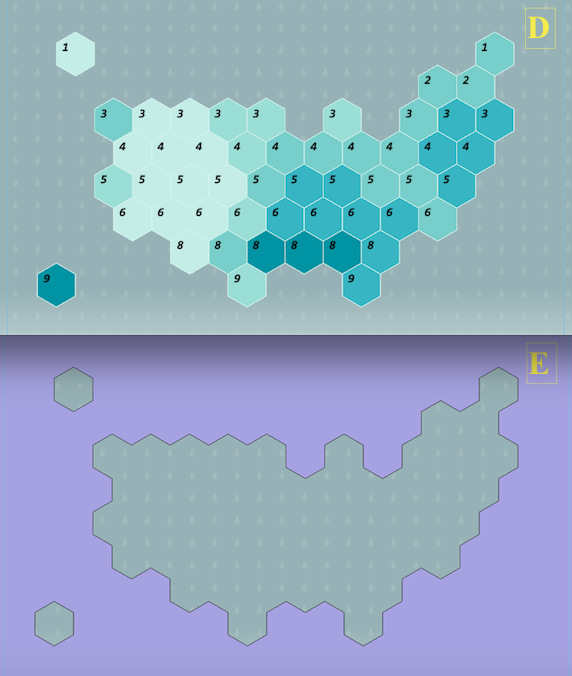
This worked but the polygons overlapped each other so I assigned a number to each row (level) of hexagons. (d) They were then split into their own layer using a definition query by the row number and layered from bottom up. (a) Now, each row of states did not overlap each other, but states with no state below went past their shape, so I created a polygon of the map frame area with the state hexagons cut out and masked each layer with it. (e)
To turn these hexagons into cubes, I used John’s cube foreground graphic and made it fill the same space as the rain level fill. So now, each state hexagon consisted of three layers: the cube foreground graphic with the move effect, the rain level fill color with the move effect, and a white fill with no effect.(c) I added a light outline on the hexagon layer, the cube foreground & background graphics and the gradient stroke background described in John’s how-to.
For the map frame, I used a raindrop symbol from an Esri symbol font as a light repeating marker fill against a dreary grey background. Then added some basic text elements for the title, legend, and notes, but chose to keep them all minimal so focus would remain on the map.
Definitely have to thank and give the majority of credit here to John - this map uses 100% of his Electo-Cubo-Gram project.