Back in 2013, I made “Virginia: Bridges of the Commonwealth” for a map contest using National Bridge Inventory data. The static map won a few awards (!!!) which is always nice, and it was an interesting project given the amount odd bridge facts I gathered from the data. (like the skinniest bridge in Virginia is 6.8 feet wide)
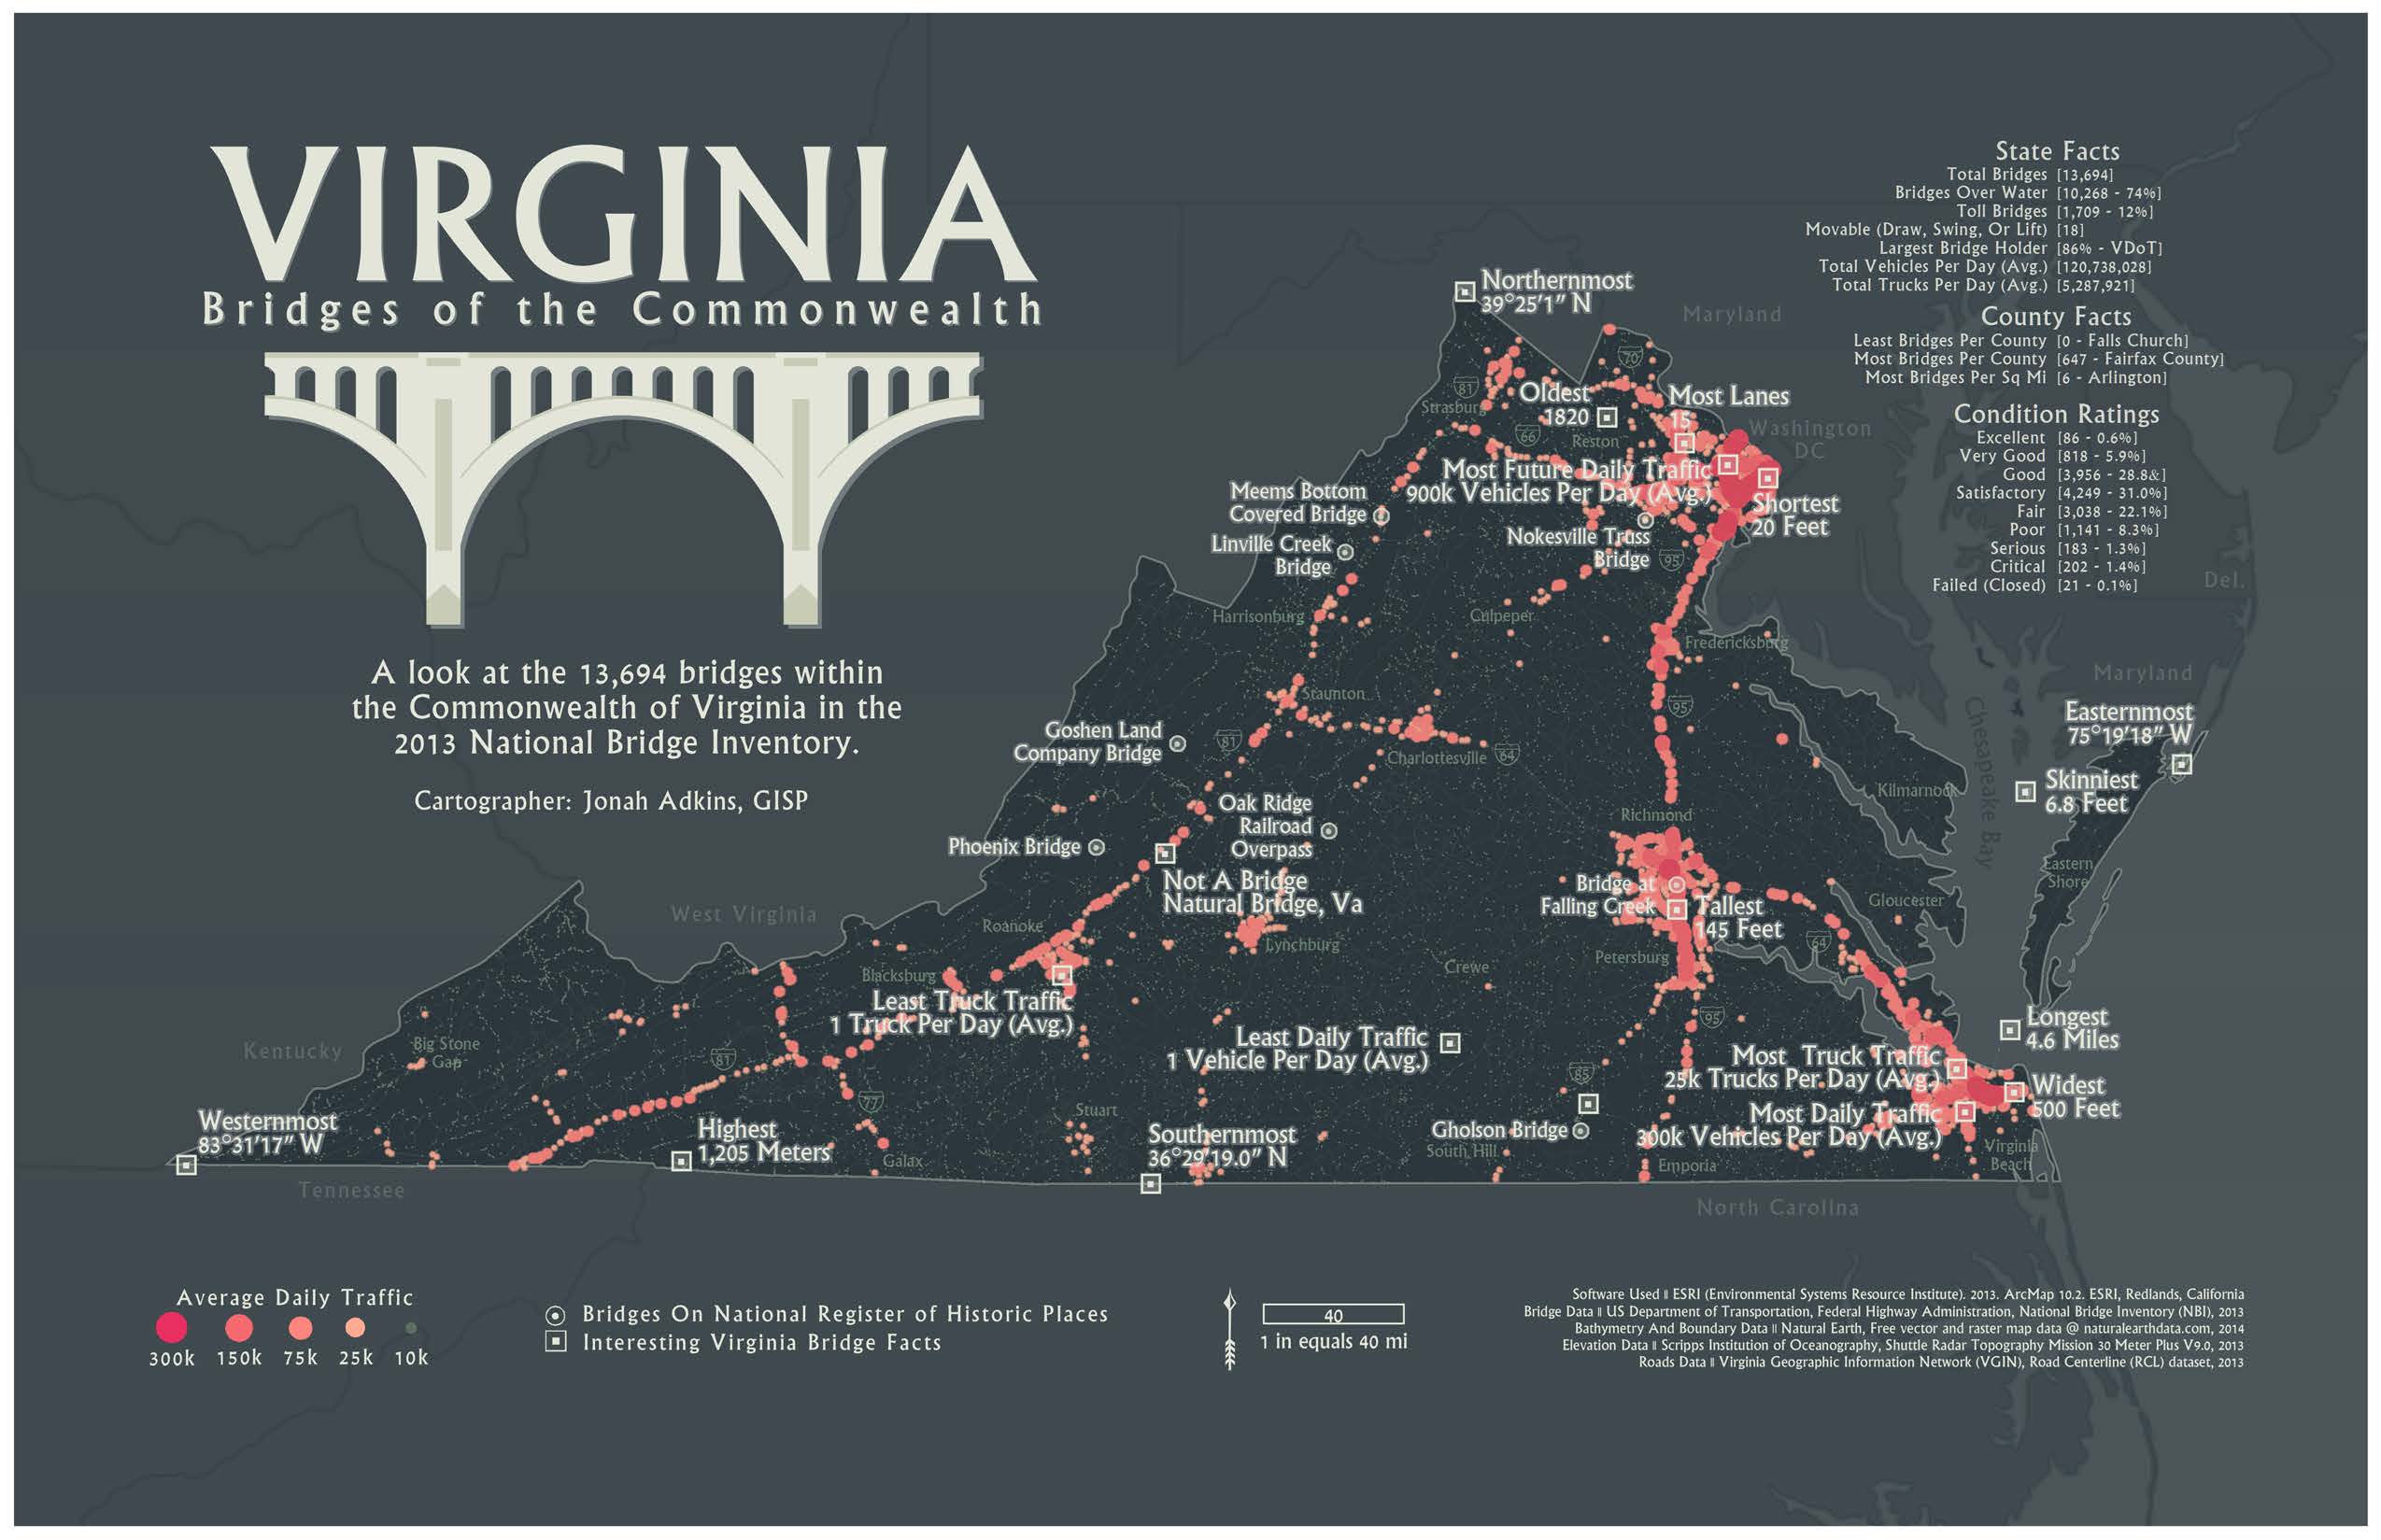
Virginia: Bridges of the Commonwealth - Static / Paper edition
While my project was limited to Virginia, the data definitely called out for a cool web map version. After a few years of that idea floating around, I got a gentle nudge from a friend that it would be a cool project, especially if I used tippecanoe.
Here’s a quick review of how it came to be:
The data used is the National Bridge Inventory from the Federal Highway Administration. They have bridge data going back to 1992 (!!!) and it’s available for download in csv format. The data also comes with a 124 page guide detailing all the attributes (like 100 fields) - most importantly lat/lng for geocoding. The coordinates are in dms but not dms. So, 80°45’10” would be 80451000 - ok, no problem, we can do some weird field calc in QGIS or you can have a friend (ask alex about this) write some funky python to do it….
wait Jonah, did you even check data.Gov to see if a geocoded version of the data exists?
So you can get the geocoded data from data.Gov in shapefile format. I brought this into QGIS, killed 98% of the fields and exported a .Geojson file. I knew I wanted to use Mapbox Studio & GL-JS to create and display the map, I did not want to upload the 300mb .geojson of 600 some thousand bridge points into my $5 per month account. So lets give tippecanoe a try - per it’s description, it “Builds vector tilesets from large collections of geojson features. This is a tool for making maps from huge datasets.” Tippecanoe is a command line utility that will, with a few parameters, take my .geojson and output .mbtiles, which I can then load up to my Mapbox account. With my .geojson handy, and using the great documentation on the github page, I dig in…
wait Jonah, did you make sure you had the latest Tippecanoe brew installed?
ugh…So make sure your using the latest version (npm, homebrew, whichever) - I followed some great examples of tippecanoe in action like this blog from Eric Fischer or this every lightning strike example by Jordan Rousseau and settled on this command
tippecanoe -pf -y extra -y date -y avgdytrfc -rg -o nbi_2015.Mbtiles nbi_2015.Geojson -z3 -z14
The final step was loading it up to my Mapbox account, applying some scale dependent (!!!) symbology based on my static map, and lastly creating a quick page to demo the maps using Mapbox-GL-JS which I highly recommend to compare the two views I created and see the power of panning/zooming over 600k points. Here’s a few static images made with the static image generator in studio.
special shot-outs to Aaron Alex, and Will for their gracious support on this project!
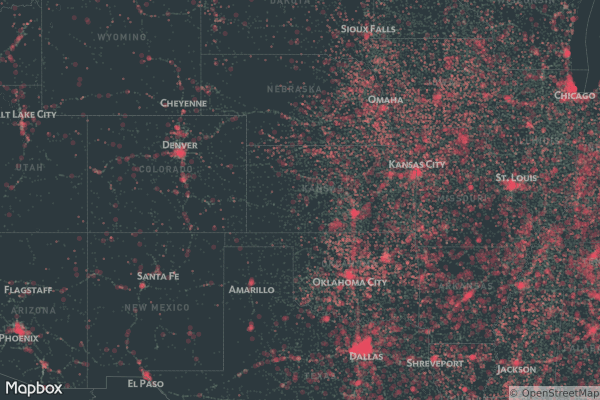
National Bridge Inventory - bridges by status (ok, structurally deficient, functionally obsolete)
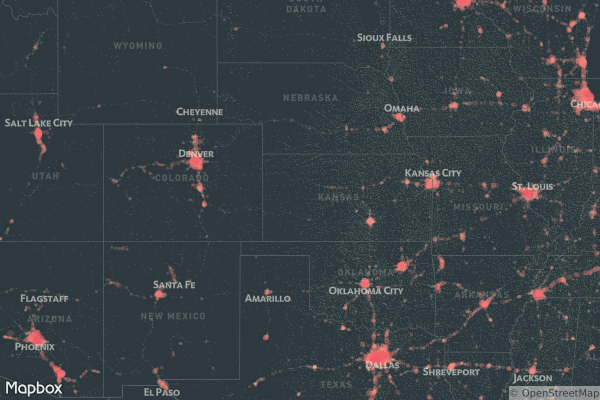
National Bridge Inventory - bridges by traffic counts (0 thru 150k per day)