I’ve been getting heavy into vector tiles at work - mostly helping clients decipher what exactly they are, migrating their traditional raster caches, training on best practices, and even designing some new basemaps!
After some recent online conversations, I was pleasantly surprised to learn with a little coding magic it’s possible to add Esri generated vector tiles to a Mapbox GL JS application.
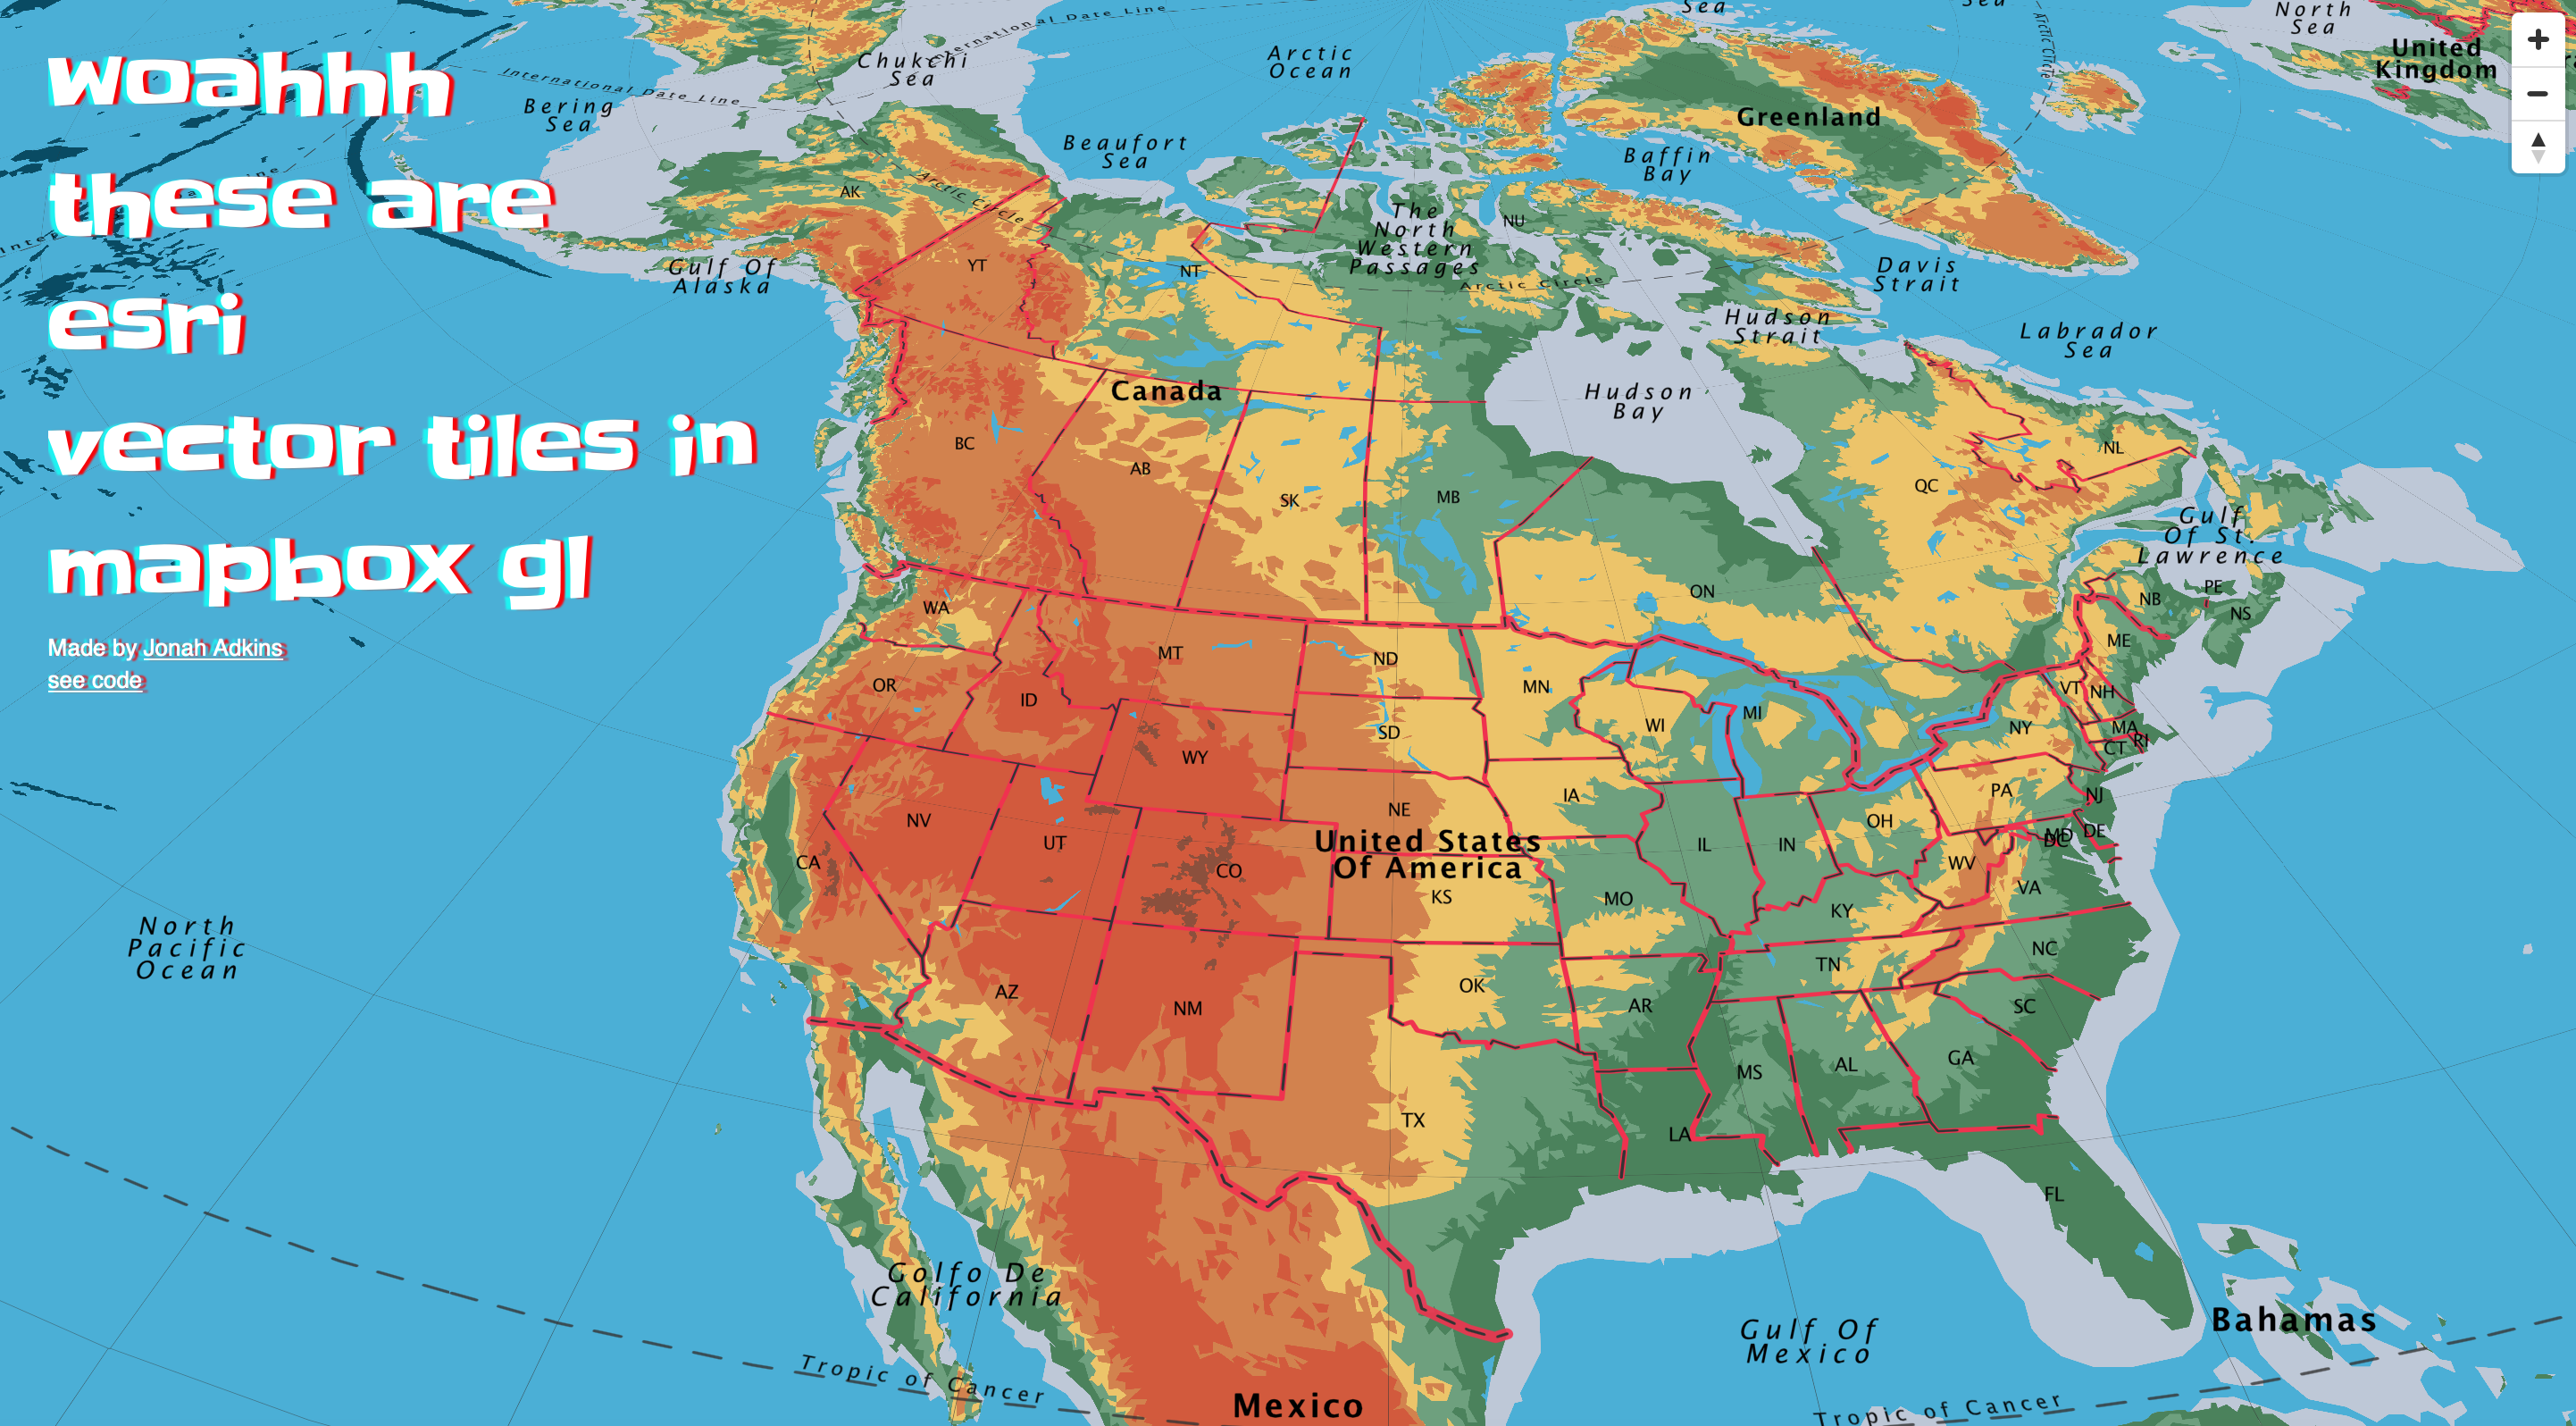
To test this out first I grabbed my azimuthal vector tiles called “Back to School 2”, added them to a quick GL-JS application and even played with the pitch and bearing settings. Check out the app or view the messy code
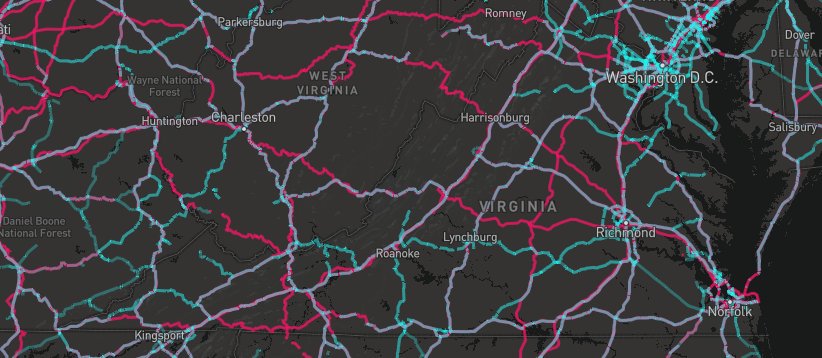
For a more detailed test, I decided to bring in data from both Mapbox data and Esri data sources. Specifically, comparing OpenStreetMap roads from mapbox (mapbox streets: road) and esri ( OpenStreetMap_FTS_v2: road + road (bridge) + road (tunnel) + road link + service road + railway + track + path + other path ) vector tiles. Looking at the code, we’re adding each as a layer and defining the style for each, instead of pointing to a style json file.map.addLayer({
"id": "road",
"type": "line",
"source": {
type: 'vector',
url: 'mapbox://mapbox.mapbox-streets-v7'
},
"source-layer": "road",
"layout": {
"line-cap": "butt",
"line-join": "miter"
},
"paint": {
"line-color": "rgba(247,21,104,0.7)",
"line-width": 3
}
}, 'waterway-label');
map.addLayer({
"id": "road2",
"type": "line",
"source": {
"type": "vector",
"tiles": ["https://basemaps.arcgis.com/arcgis/rest/services/OpenStreetMap_FTS_v2/VectorTileServer/tile/{z}/{y}/{x}.pbf"]
},
"source-layer": "road",
"layout": {
"line-cap": "butt",
"line-join": "miter"
},
"paint": {
"line-color": "rgba(65,244,244,0.3)",
"line-width": 3
}
}, 'waterway-label');
Here we can see that adding an Esri vector tile service is a bit different from adding Mapbox tiles. For the Esri tiles, we’re referencing the pbf with the appropriate tiling scheme (z/x/y) using the tiles property instead of url property. To pull in each road type from Esri, I downloaded the style json and looked for references to road layers.
The Vector Tile Battle Royal GL-JS app allows for detailed examination of the intricacies of how each provider displays roads and road categories at each zoom level. Code for this app is available via github.
As usual, email me or hit me up on twitter if you want some more details or have any general questions.